Github Profile是什么
一般情况下,GitHub 个人主页会显示其仓库信息、提交信息。但是如果你拜访别人的github,会发现有些主页能够让你眼前一亮。这种定制的主页能够更加详细地介绍你的贡献、提交信息以及个人信息,远比默认主页包含了更多信息。当然,大家也可以照抄我Github中的配置然后修改,我的配置文件的地址如下。
Github:QTH1225/QTH1225
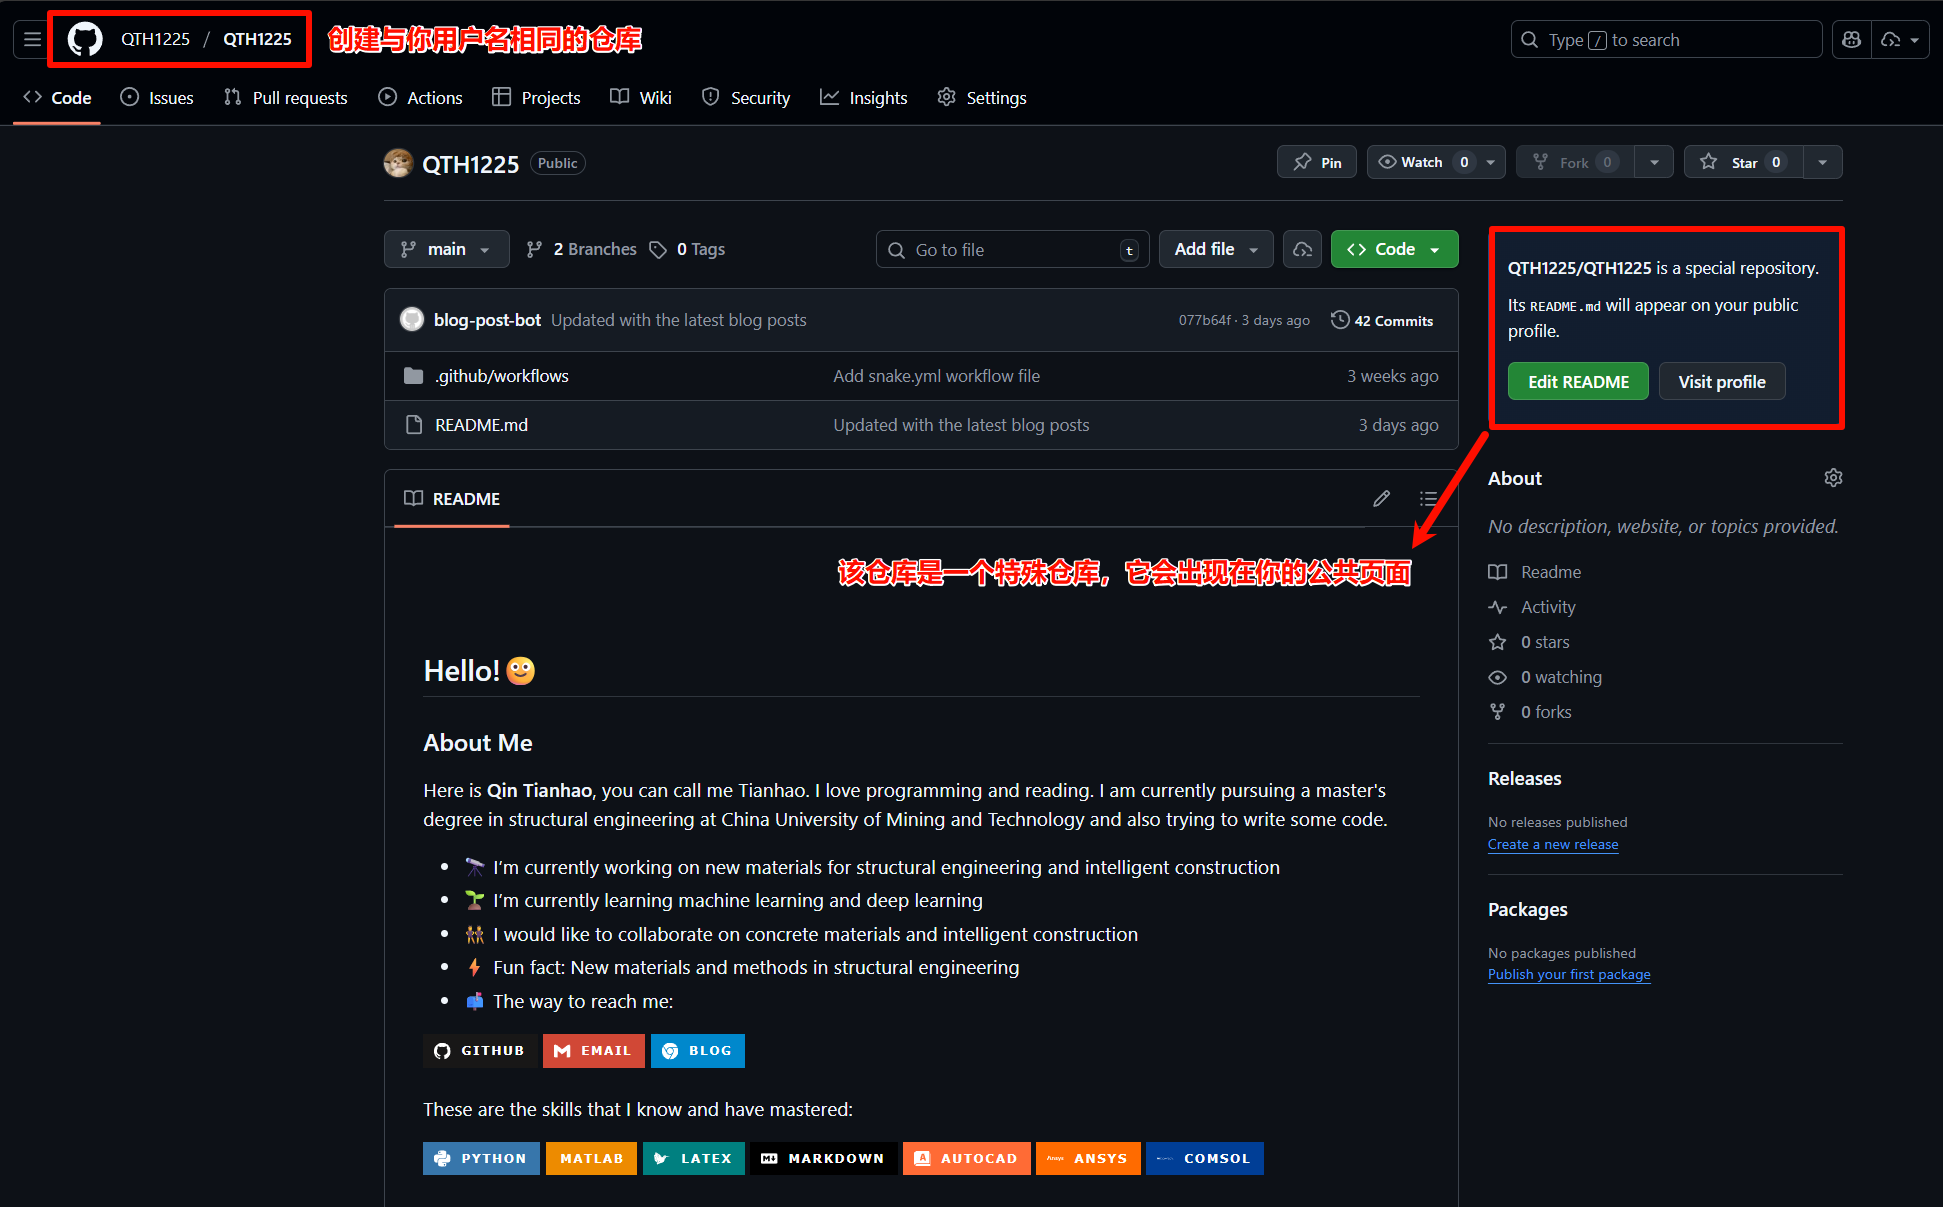
我们先了解github中profile中设置方法,然后再进行美化。我们首先在 GitHub 上新建一个仓库,仓库名和自己 Github 用户名相同,然后添加一个 README.md 自述文件,在该文件里添加信息即可。该文件中的信息会自动添加到你的Github主页中。
侧边栏的定制
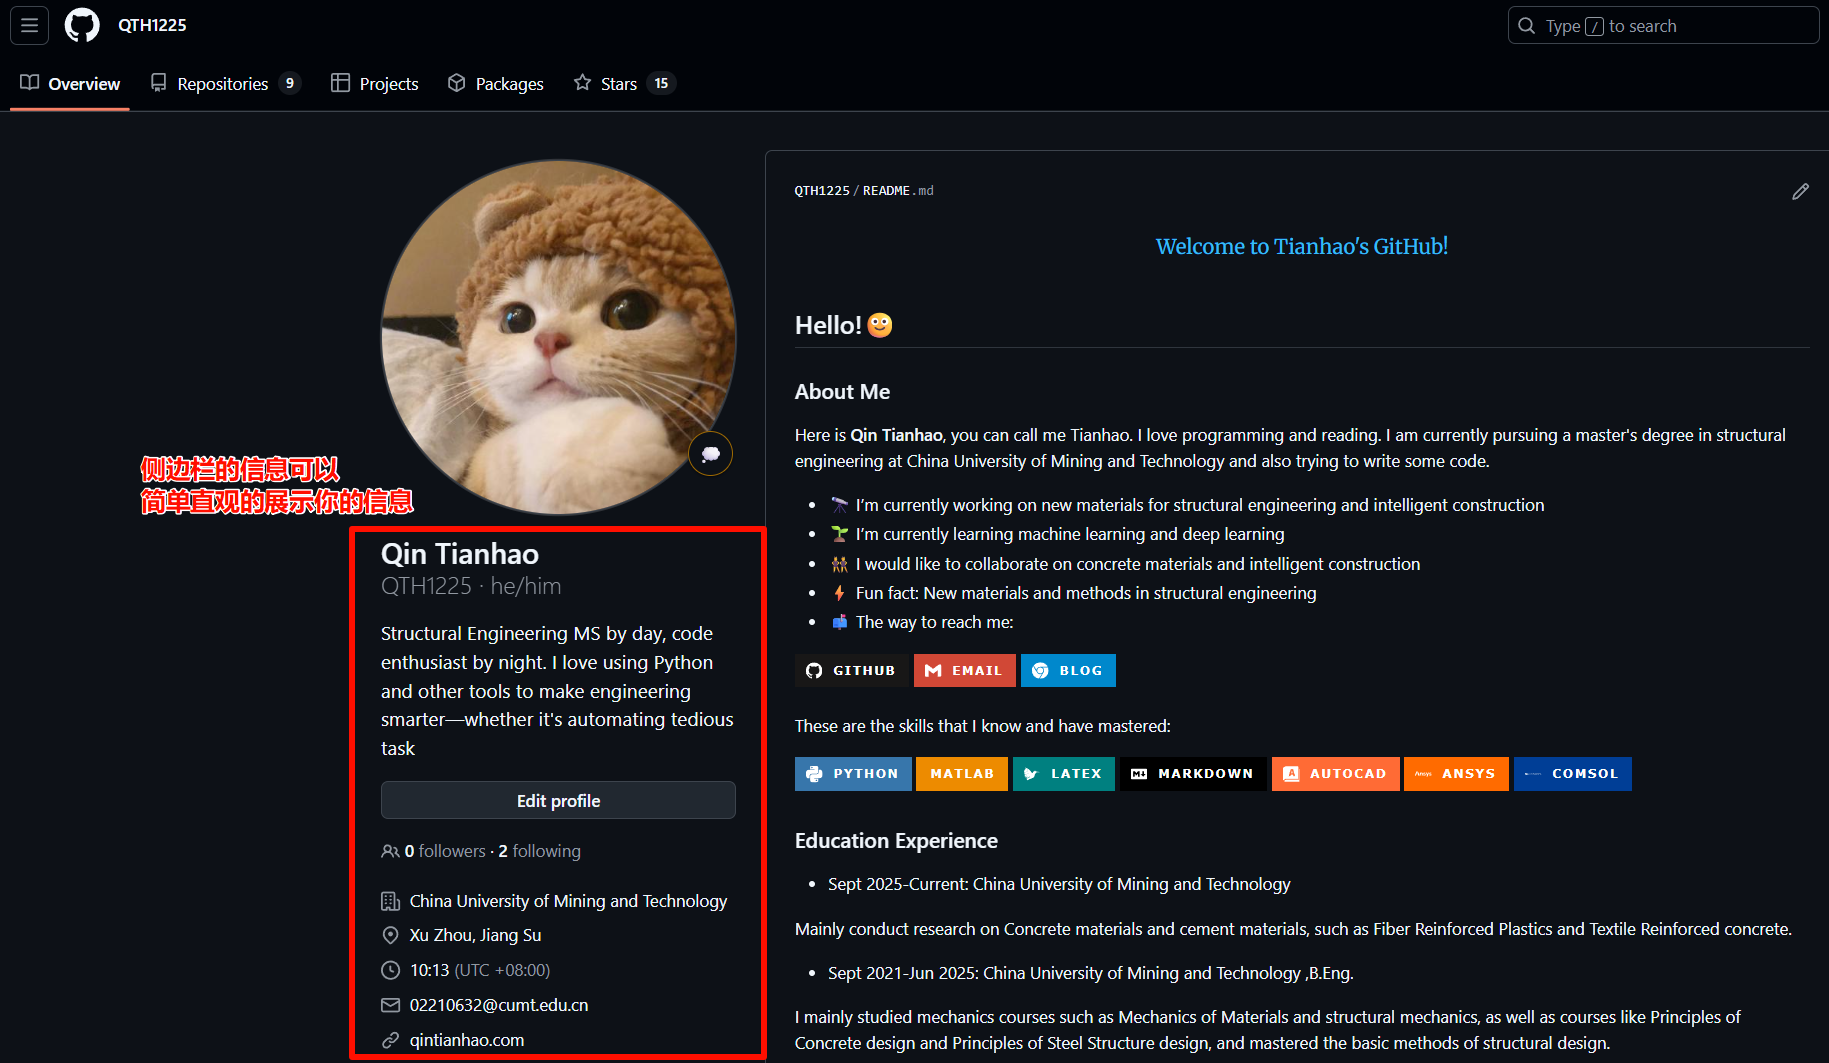
当然,在我们定制自己的github主页前,别忘了GitHub在侧边栏也可以添加自己的基本信息,包括名字、签名、公司、邮箱以及链接等。侧边栏也是个人信息中很重要的一部分。
所使用的组件
打字机
你可以以打字机的形式展示你的GitHub信息,可以产生如下效果:
该项目的地址如下
DenverCoder1/readme-typing-svg
当然,你可以调整字体以及出现的位置和大小,例如我仓库中的配置是这样的。
[](https://git.io/typing-svg)徽章
你可以以徽章的形式简要地展示你的技术栈或者联系方式。博主所使用的是Shields.io进行生成徽章。 这些徽章可以是链接到你的个人信息页面,例如下面这些徽章。
[](https://github.com/QTH1225)
[](mailto:1340356343@qq.com)
[](https://tianhao.blog)
These are the skills that I know and have mastered:当然,他们也可以仅作展示之用。





博客链接
如果你有自己的技术博客,且带有RSS功能,那么你可以在你的GitHub profile中链接到你博客的最新文章。
gautamkrishnar/blog-post-workflow
根据该仓库的说明,首先你需要将以下片段加到你的Markdown文件中,接下来创建的工作流会将<!-- BLOG-POST-LIST:START -->与<!-- BLOG-POST-LIST:END -->中的部分替换为你的最新博客。
### Blog posts
Here is my blog. You can find some of my study and thinking records here.
<!-- BLOG-POST-LIST:START -->
<!-- BLOG-POST-LIST:END -->
然后创建一个workflow(例如 blog-post-workflow.yml ),内容如下。并改动最后一行的feed_list后的内容为你博客的RSS链接。
name: Latest blog post workflow
on:
  schedule: # Run workflow automatically
    - cron: '0 * * * *' # Runs every hour, on the hour
  workflow_dispatch: # Run workflow manually (without waiting for the cron to be called), through the GitHub Actions Workflow page directly
permissions:
  contents: write # To write the generated contents to the readme

jobs:
  update-readme-with-blog:
    name: Update this repo's README with latest blog posts
    runs-on: ubuntu-latest
    steps:
      - name: Checkout
        uses: actions/checkout@v4
      - name: Pull in dev.to posts
        uses: gautamkrishnar/blog-post-workflow@v1
        with:
          feed_list: "https://tianhao.blog/index.xml" # Replace this with your RSS link
贪吃蛇数据贡献图
你可以在你的GitHub profile中以贪吃蛇的形式展示你的贡献图,就像这样

snk.yml ),内容如下,不需要进行任何提交或改动。
name: generate animation

on:
  # run automatically every 2 hours
  schedule:
    - cron: "0 */2 * * *"

  # allows to manually run the job at any time
  workflow_dispatch:

  # run on every push on the master branch
  push:
    branches:
    - master


jobs:
  generate:
    permissions:
      contents: write
    runs-on: ubuntu-latest
    timeout-minutes: 5

    steps:
      # generates a snake game from a github user (<github_user_name>) contributions graph, output a svg animation at <svg_out_path>
      - name: generate github-contribution-grid-snake.svg
        uses: Platane/snk/svg-only@v3
        with:
          github_user_name: ${{ github.repository_owner }}
          outputs: |
            dist/github-contribution-grid-snake.svg
            dist/github-contribution-grid-snake-dark.svg?palette=github-dark


      # push the content of <build_dir> to a branch
      # the content will be available at https://raw.githubusercontent.com/<github_user>/<repository>/<target_branch>/<file> , or as github page
      - name: push github-contribution-grid-snake.svg to the output branch
        uses: crazy-max/ghaction-github-pages@v3.1.0
        with:
          target_branch: output
          build_dir: dist
        env:
          GITHUB_TOKEN: ${{ secrets.GITHUB_TOKEN }}
然后,我们需要在Markdown文件中加入下面的HTML代码,将所有链接改为你自己的即可。
<picture>
<source media="(prefers-color-scheme: dark)" srcset="https://raw.githubusercontent.com/QTH1225/QTH1225/output/github-contribution-grid-snake-dark.svg">
<source media="(prefers-color-scheme: light)" srcset="https://raw.githubusercontent.com/QTH1225/QTH1225/output/github-contribution-grid-snake.svg">
<img alt="github contribution grid snake animation" src="https://raw.githubusercontent.com/QTH1225/QTH1225/output/github-contribution-grid-snake.svg">
</picture>
GitHub访客量统计
你可以直接在Markdown文件中插入以下代码统计你个人主页的访问量。使用Moe Counter!直接生成你需要插入的代码,然后插入你的Markdown文档中即可。这里使用的是moebooru主题,也可以替换为其他主题。
The number of views of this page is as follows.

<img src="https://count.getloli.com/@QTH1225?theme=moebooru"/>
GitHub数据统计
在GitHub profile中也可以统计你GitHub的提交数据或者仓库数据。这里所使用的仓库如下。 anuraghazra/github-readme-stats 你可以在该仓库中选择你喜欢的统计样式与数据(不限于展示这两种哦)。这里博主采用了仓库中的HTML语法进行卡片对齐操作,复制该代码并将用户名替换为你的用户名可以直接使用。
<a href="https://github.com/anuraghazra/github-readme-stats">
  <img height=200 align="center" src="https://github-readme-stats.vercel.app/api?username=QTH1225&show_icons=true&theme=transparent" />
</a>
<a href="https://github.com/anuraghazra/convoychat">
  <img height=200 align="center" src="https://github-readme-stats.vercel.app/api/top-langs?username=QTH1225&layout=donut&langs_count=5&card_width=320&theme=transparent" />
</a>
GitHub提交月份统计图
你可以在你的GitHub profile中以折线图的形式展示你的贡献月度变化,如下所示。
博主所使用的仓库是这个,可以在仓库中自行选择喜欢的样式进行调整。
Ashutosh00710/github-readme-activity-graph
将这段代码加入到你的Markdown文件中并改为你自己的信息即可。
[](https://github.com/ashutosh00710/github-readme-activity-graph)GitHub Profile编辑器
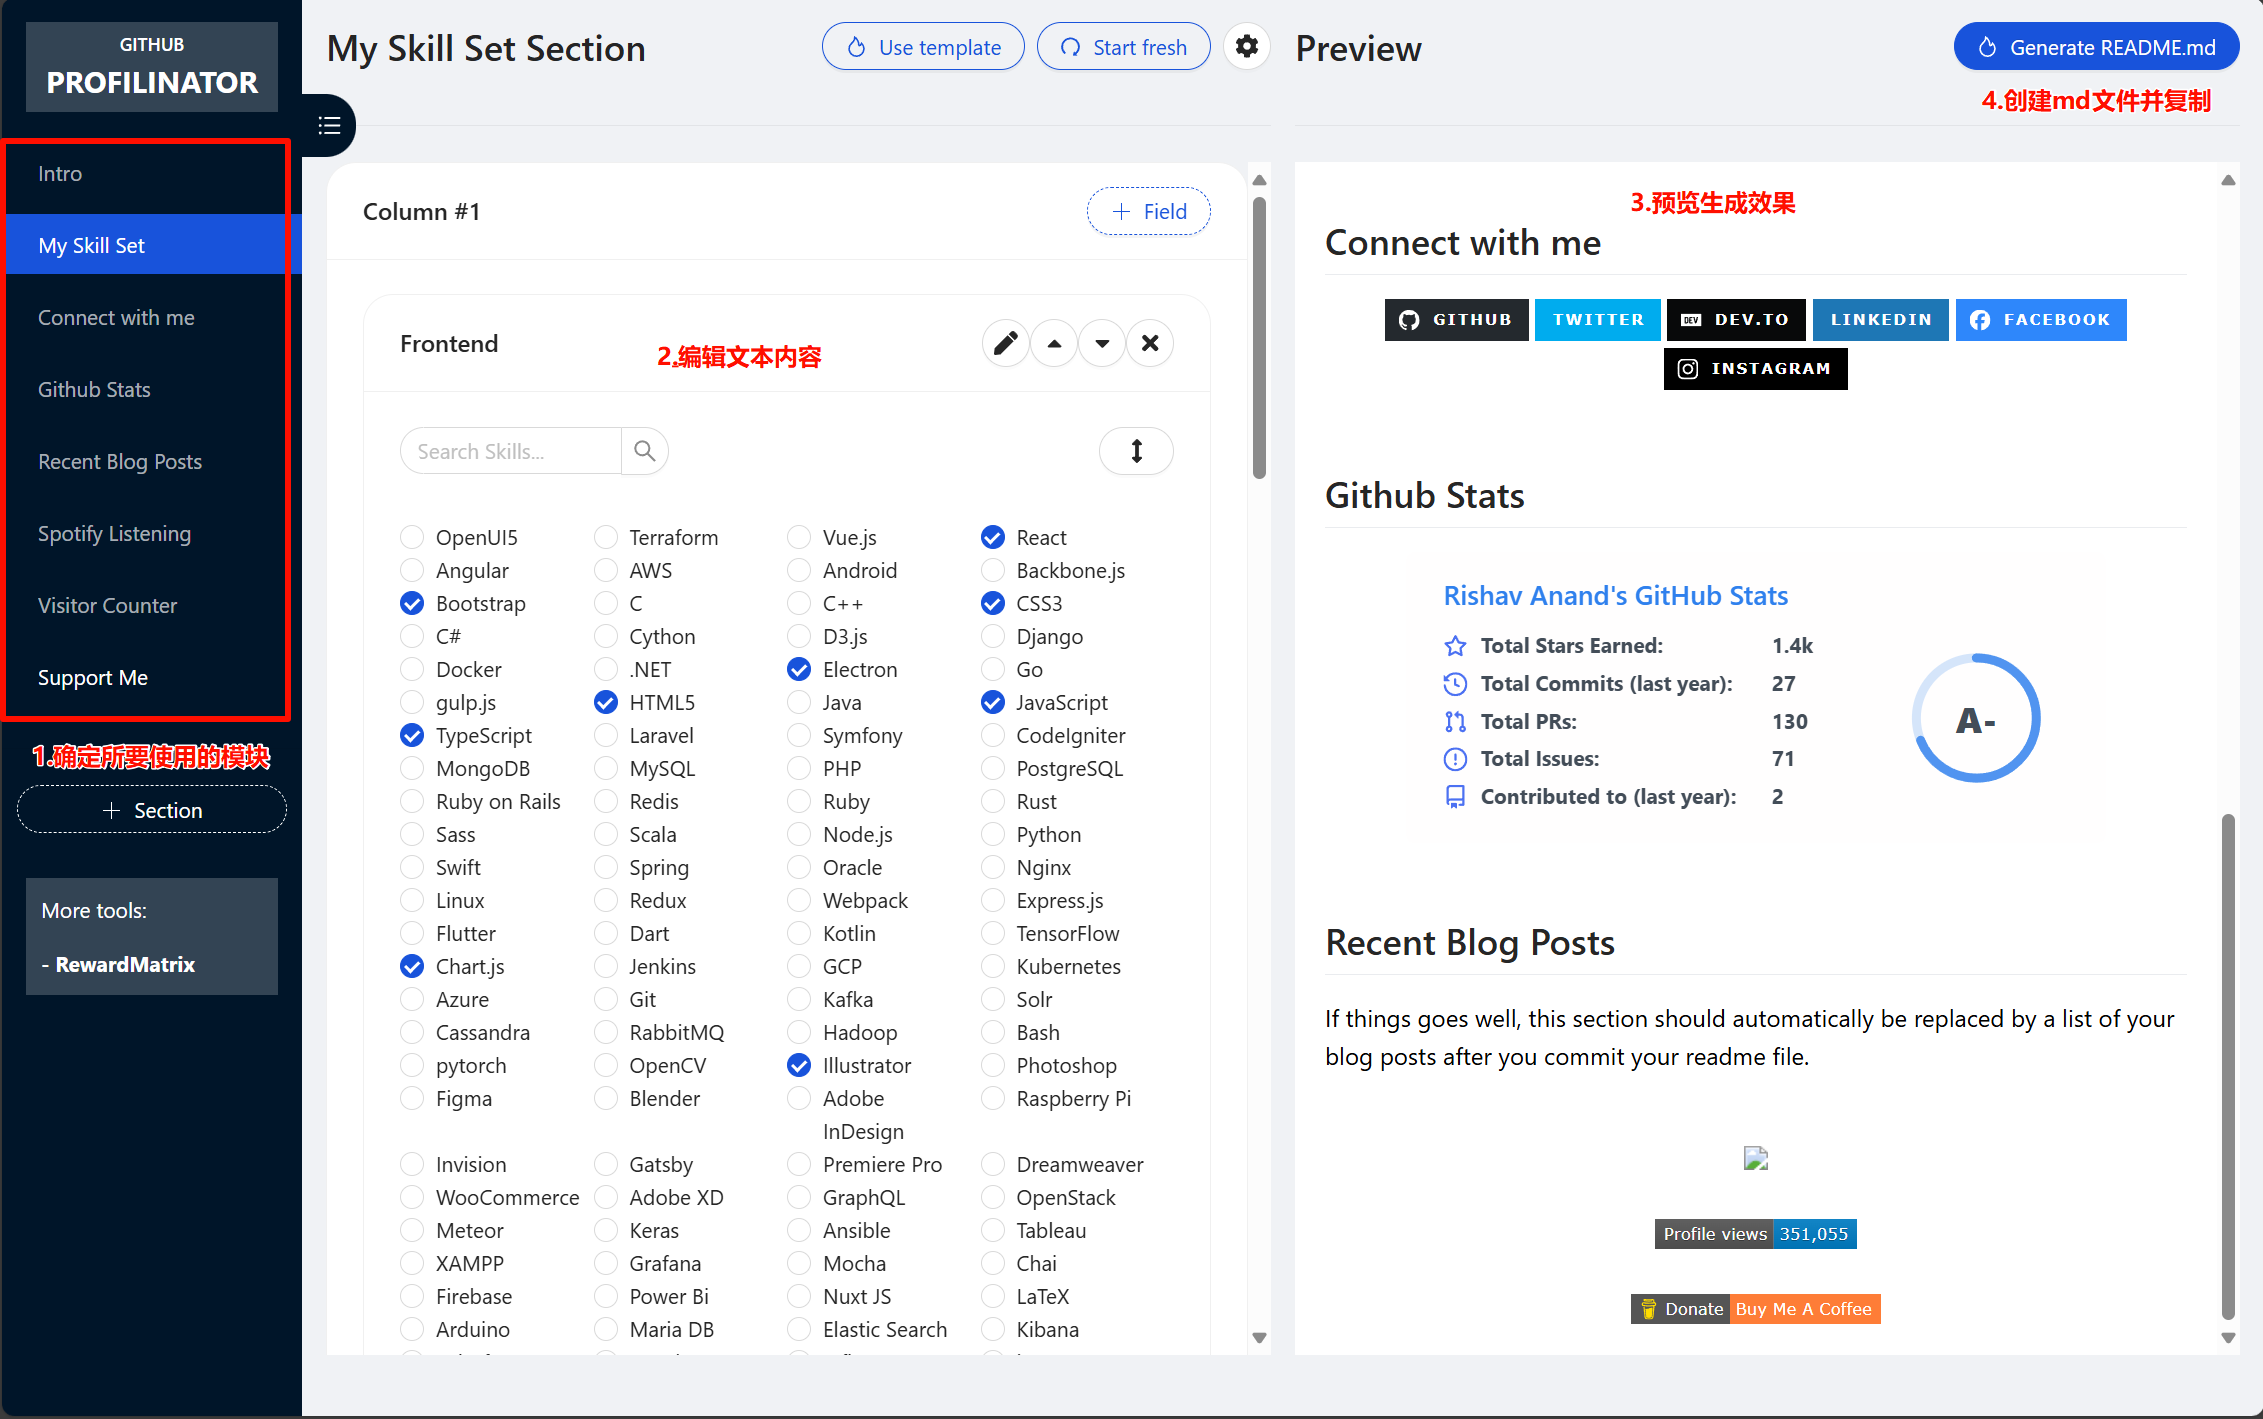
如果你不想进行繁琐组件研究,那么你可以使用GitHub Profile编辑器。这是一个是一个可视化 profile 生成工具,使用者无需学习 Markdown 语法,仅需要在对应窗口中输入或者选择相应的内容,工具会自动生成 Markdown 脚本。脚本编辑完成以后,直接复制粘贴到自己的 Github 即可。
放在最后
再次感谢所有这些开源组件的创作者以及相关配置教程的撰写者,这些都在博主配置过程中给予了莫大的帮助。本文主要参考的是:
评论